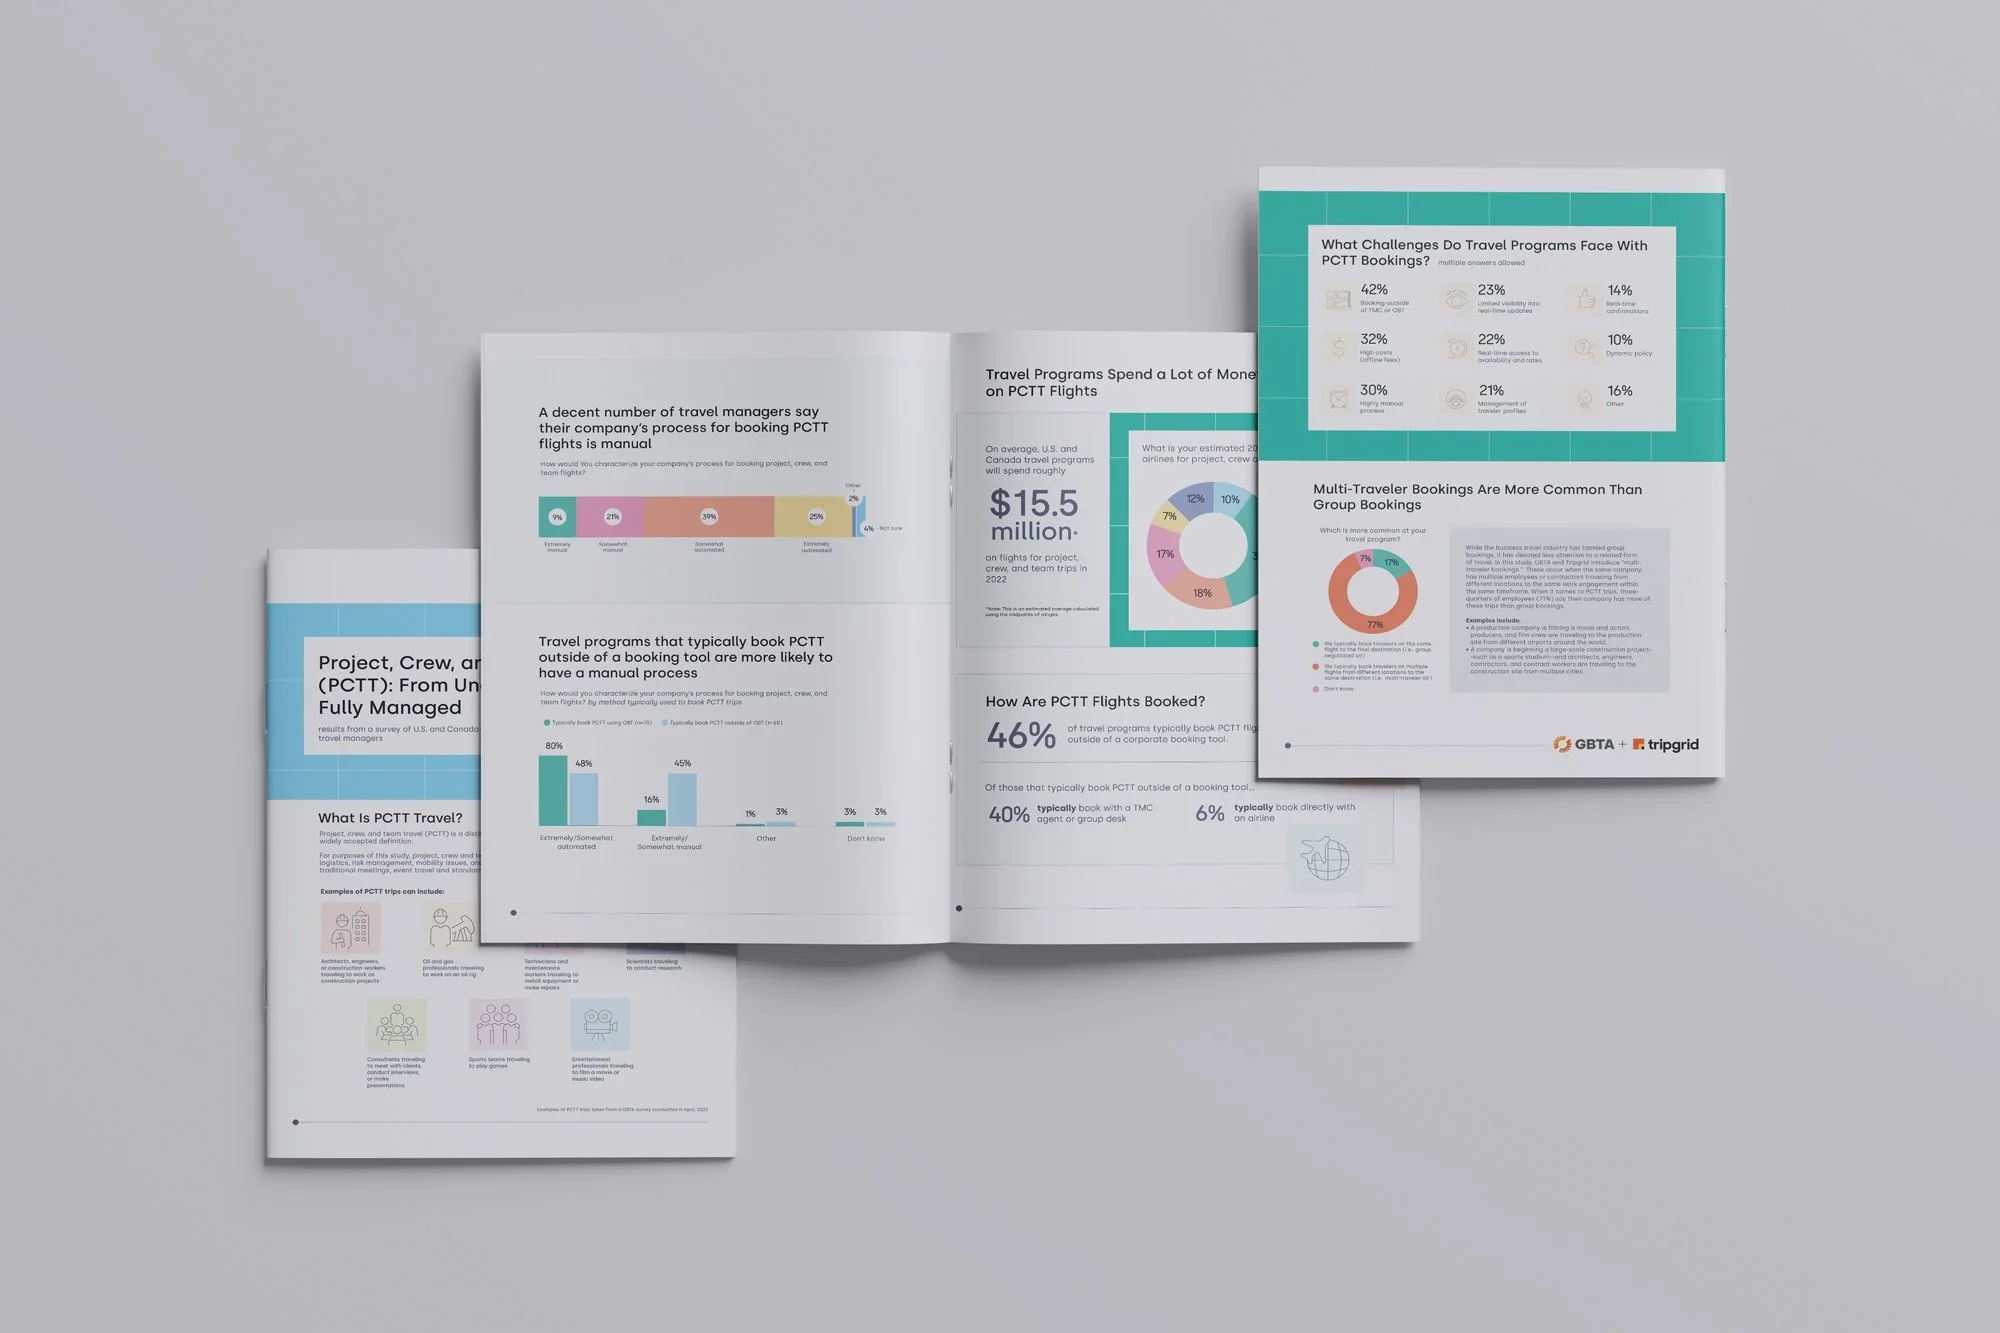
Infographic Global Business Travel Association (GBTA)
Show what you mean.
GBTA is the association for all things business travel. Beyond serving its global members, GBTA delivers research about the latest travel trends. It also partners with private sector companies such as AMEX, Uber & Freenow to publish industry specific information. With numbers, stats and data flying and the rapid change in travel, the association needs “at-a-glance” communication. MAD Creative creates reports conveying information in easy-to-understand chunks while still telling the story. So non-number crunchers can get at the important numbers. Easily.
Infographic posters about ground transportation in Europe, showing traveler perspectives, statistics, and environmental impact data, with illustrations of travelers and vehicles.
Open booklet with colorful graphs and charts on gray background, focusing on travel programs and booking data.
A series of presentation slides about business travel and sustainability, featuring graphs, charts, and images of travelers and business meetings.
Two infographic reports about the post-pandemic travel program, featuring charts and statistics on traveler perceptions and effectiveness of remote work, with a blue and white color scheme.
Cover page of a report titled "How travel managers will succeed in 2023" with a red background and white text, featuring logos of GBTA and SPOTT/N/A.
Open magazine spread with data visualizations and text about challenges faced by travel managers and business leaders in 2023, including statistics on concerns, travel disruptions, and focus on cost savings and policy compliance.
An open report or brochure displaying statistics on travel program success factors in 2023. The left page shows that 49% consider cost metrics most important, 32% prioritize travel experience, and 6% focus on sustainability. The right page lists top pain points for travelers, including end-user experience (49%), managing changes or cancellations (47%), innovation (41%), content (34%), richness of display (34%), multiple device experience (27%), guest booking (27%), and analytics/reporting (9%). Red and blue icons accompany each statistic, with decorative blue lines and a red airplane graphic.
Melissa is incredibly talented. She takes complex insights and graphically presents them in a way that generates interest and deep understanding of our research.
Chris Ely, Director of Research, GBTA